
Oct 29, 20254 minS2
In this episode of Chart Tales, the hosts discuss insights from Felipe Rego’s session at the World Data Summit Virtual Roundtable, where he explored how emotion, storytelling, and artificial intelligence shape the...

technology
Hosted by Felipe Rego · technology · EN
Welcome to Chart Tales: An AI-powered podcast on Data Visualization & Storytelling Ideas , where we explore Felipe Rego's practical tips, creative ideas, and expert advice to help you master the art of data visualization and storytelling. New episodes every Wednesday 10am AEST. Each episode dives into strategies for planning, building, and delivering impactful data-driven solutions, making complex information clear and engaging. Whether you’re an aspiring data storyteller or a seasoned professional, Chart Tales offers valuable insights to enhance your skills and elevate your presentations. Tune in to learn how to bring your data to life and communicate insights that drive action. Hosted on Acast. See acast.com/privacy for more information.
Required Pod Score for this podcast. PitchCentric checks your profile against host openness, topical fit, and audience signals before you generate a pitch.
Contact path
Verified email
Booking probability
19%
Guest openness
Selective
Sign up to generate a grounded pitch for Chart Tales: Data Visualisation & Storytelling Ideas.
Signup to Generate a PitchWelcome to Chart Tales: An AI-powered podcast on Data Visualization & Storytelling Ideas, where we explore Felipe Rego's practical tips, creative ideas, and expert advice to help you master the art of data visualization and storytelling. New episodes every Wednesday 10am AEST.
Chart Tales: Data Visualisation & Storytelling Ideas is hosted by Felipe Rego. The show has published 14 episodes to date.
Recent episodes include "Unlocking the Emotional Power of Data Visualisation and Storytelling" (29 October 2025, 4 minutes), "How Data Visualisation is Transforming Investor Relations" (19 October 2025, 4 minutes), and "How Do You Turn Data into a Story?" (9 October 2025, 3 minutes).
Chart Tales: Data Visualisation & Storytelling Ideas publishes roughly weekly, with episodes averaging 6 minutes across 14 episodes.
Booking probability for Chart Tales: Data Visualisation & Storytelling Ideas is 19%, and the host is rated Selective on guests. Chart Tales: Data Visualisation & Storytelling Ideas requires a Pod Score of 80 or higher. Chart Tales: Data Visualisation & Storytelling Ideas's contact route on record: verified email.
The strongest fits for Chart Tales: Data Visualisation & Storytelling Ideas are IT Services & Software Development. Chart Tales: Data Visualisation & Storytelling Ideas has a technology audience.
Felipe Rego hosts Chart Tales: Data Visualisation & Storytelling Ideas, a technology podcast with 14 episodes published.
Our AI reads these to draft pitches. Use them as grounding for a pitch that cites a real guest and a specific topic.
In this episode of Chart Tales, the hosts discuss insights from Felipe Rego’s session at the World Data Summit Virtual Roundtable, where he explored how emotion, storytelling, and artificial intelligence shape the...

In this episode, we unpack Felipe Rego’s insights on elevating investor relations through storytelling and data visualisation. Drawing on part of his work with a leading Caribbean financial institution, Felipe discusses...
Episode #2
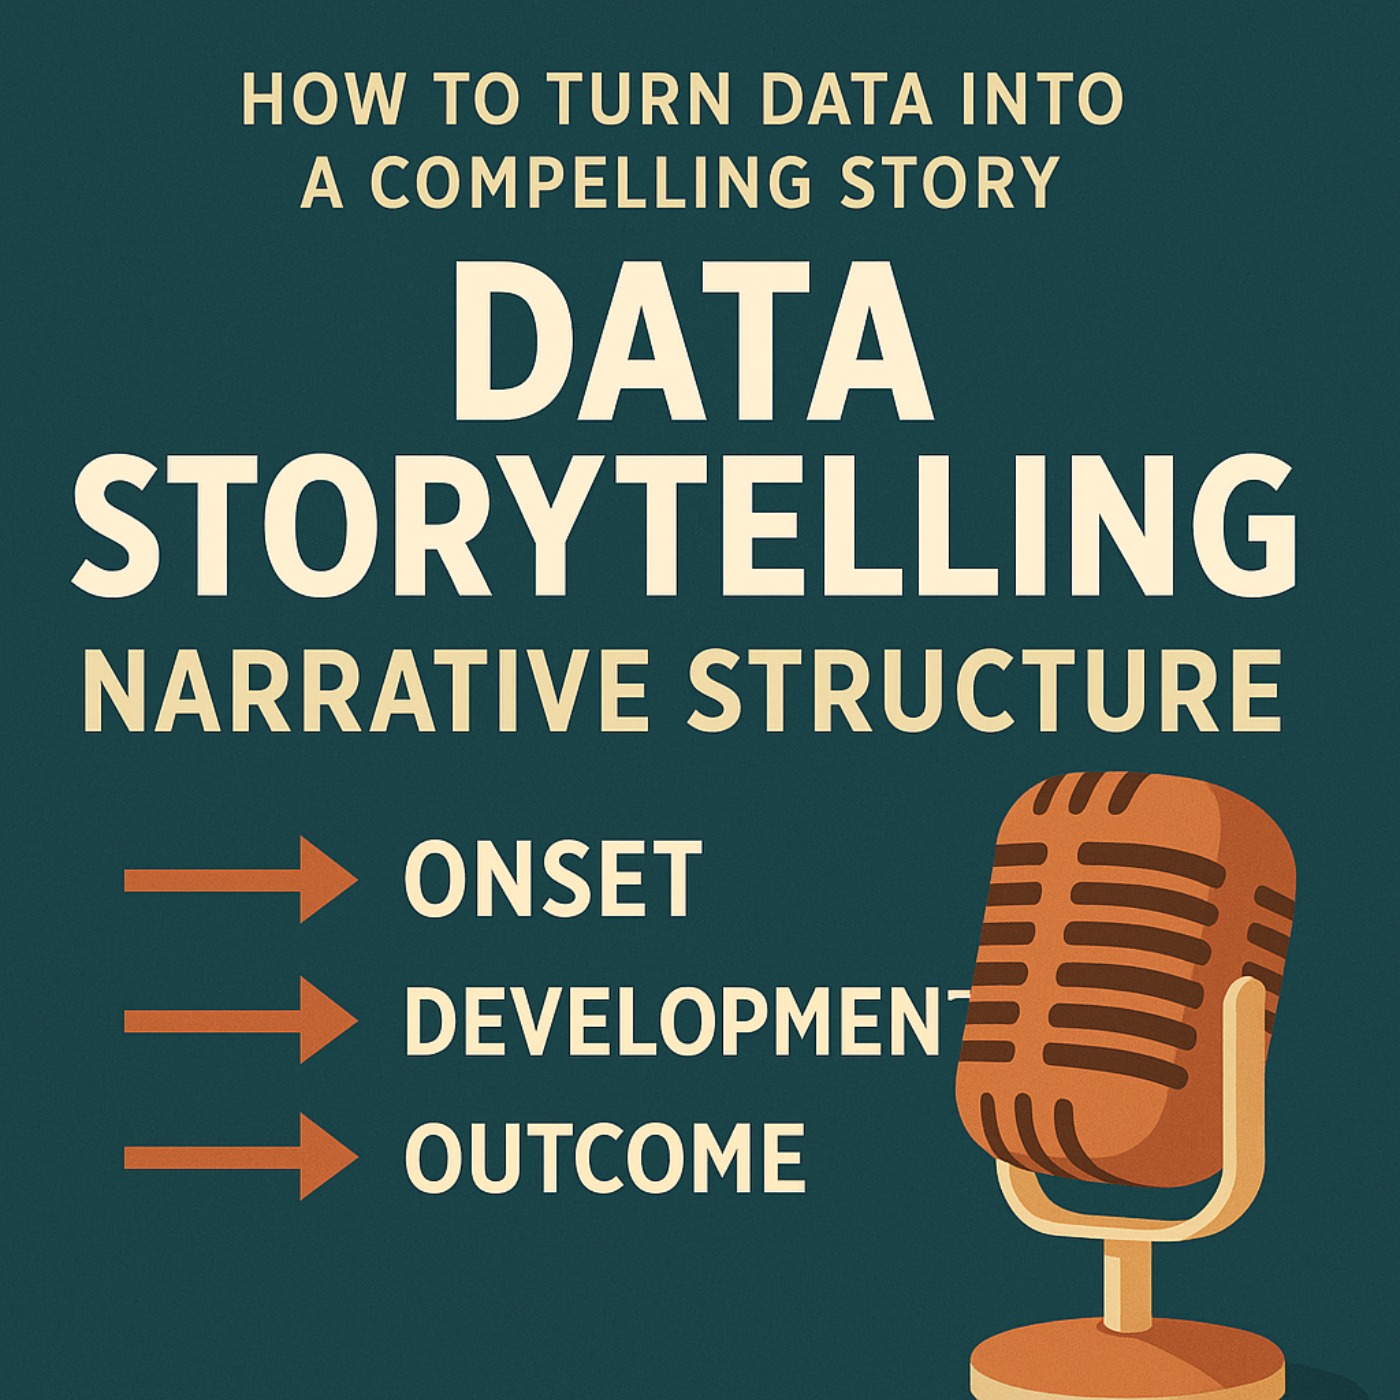
Learn how to turn data into a compelling story using the three-act narrative structure: Onset, Development, and Outcome. This data storytelling framework honed by Felipe Rego helps you set context, uncover insights, and...

Episode #1
Revolutionizing Data Visualization: Can AI Turn Words into Good Charts? In this episode we explore the Promise, Pitfalls, and Future of NL2VIS Systems from a recent research from a team at Microsoft Research and...

In this episode Felipe Rego shares three tips for improving the scoping phase of data, analytics and data visualisation projects: using pauses to gather insights, allowing clients to think aloud, and paraphrasing while...
Episode #9
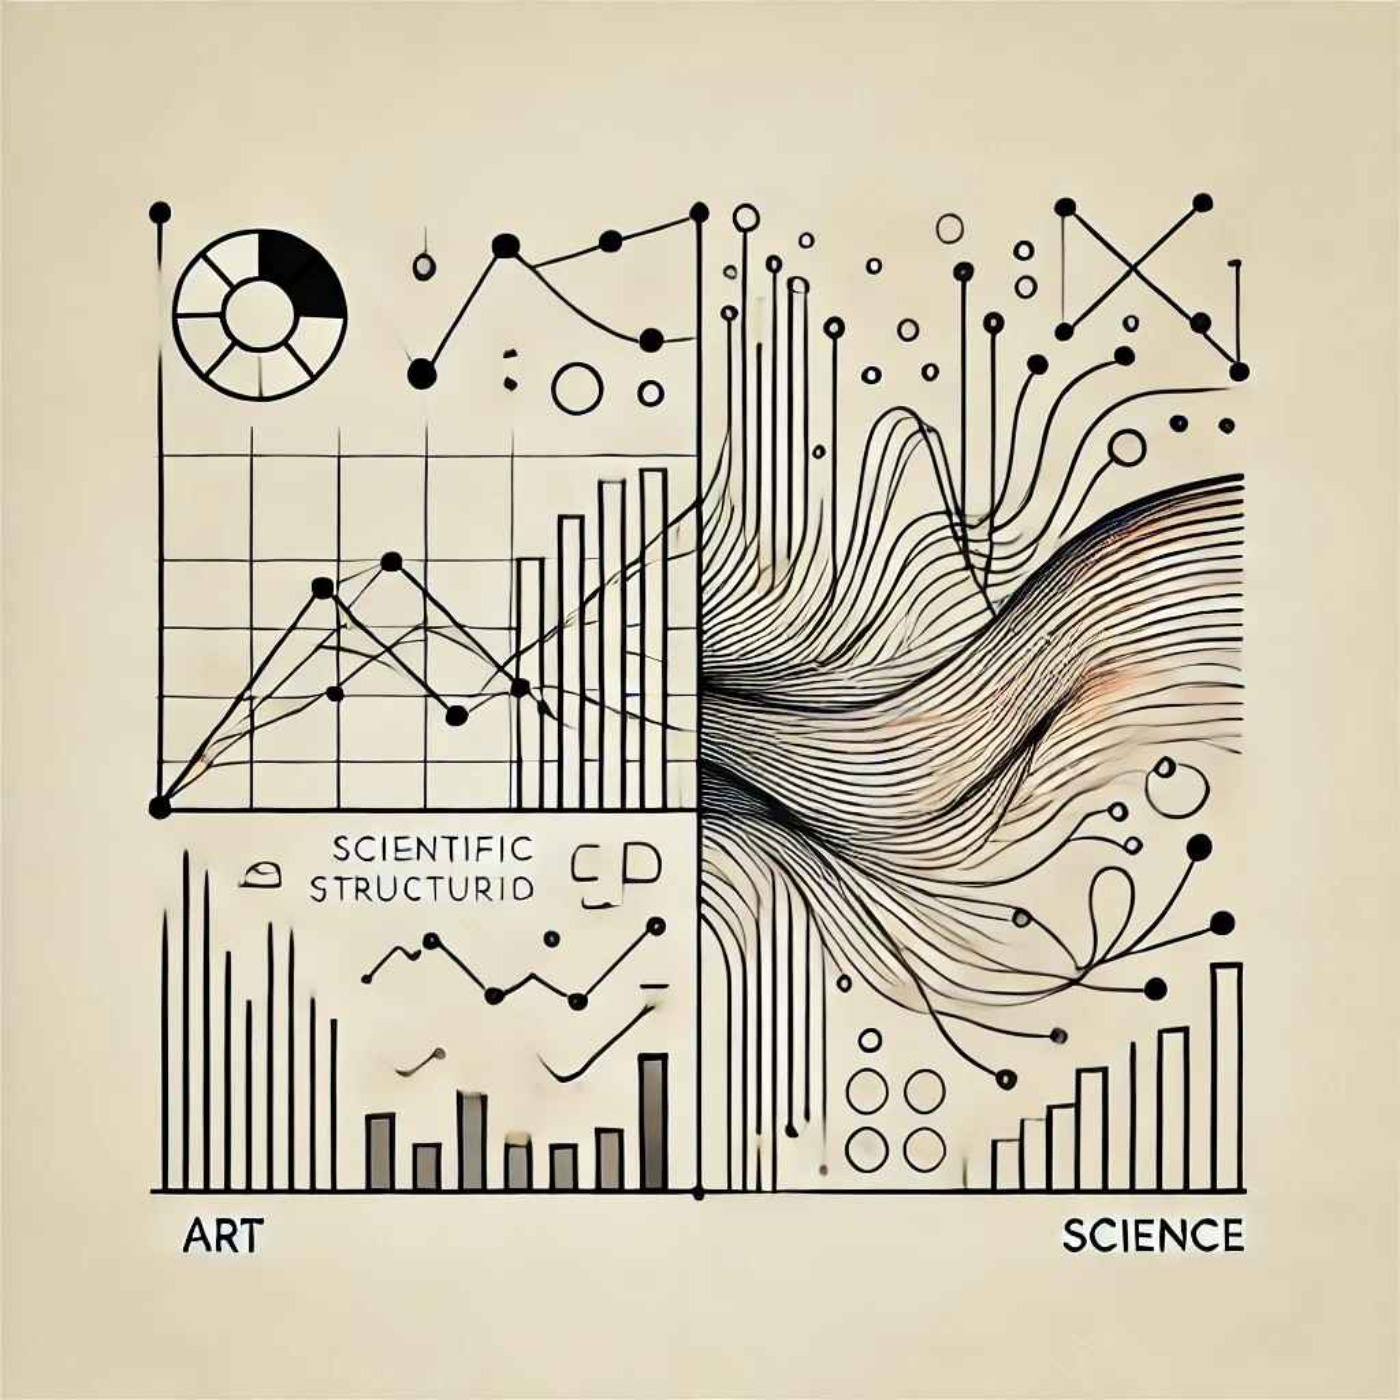
In this episode, we briefly and loosely define Felipe Rego's concept of data visualization as a process that involves art and science with the intent to magnify knowledge for those who consume it. Professionals with a...

This episode highlights Felipe Rego's four key strategies for successful data visualization projects: defining the problem clearly, thoroughly exploring data, developing effective visual encodings, and creating a strong...
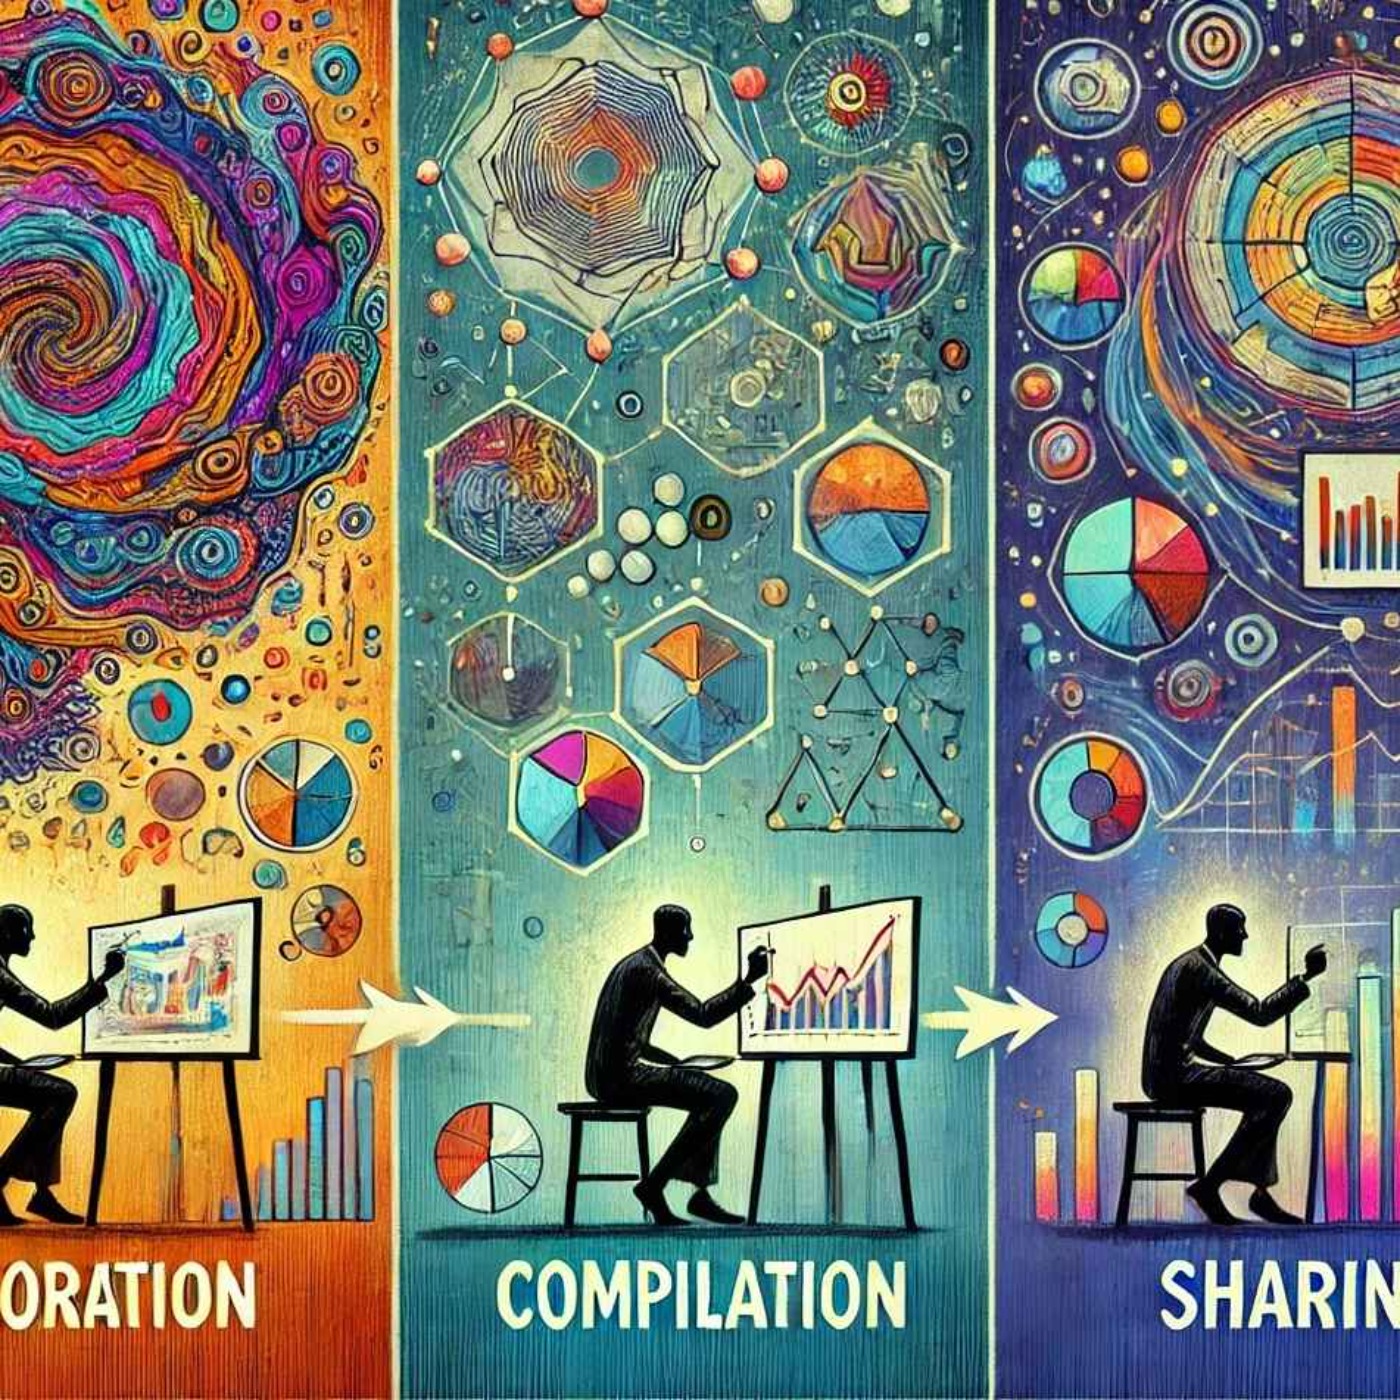
This episode outlines a three-phase process for successful data visualizations and storytelling solutions: exploration, compilation, and sharing, emphasizing iterative refinement for impactful storytelling.<p > Hosted...

This episode offers practical steps based on Felipe Rego's ideas to enhance data visualization and storytelling skills. It emphasizes having a clear objective, using relevant data, designing with the audience in mind...
In this episode, Felipe Rego provides leaders with insights on mastering data visualization and storytelling by focusing on foundational visualization techniques, adopting design best practices, crafting compelling...

Explore the differences between good and bad data visualization through a bar chart example, emphasizing the importance of simplicity, clarity, and logical design choices in telling compelling data stories.<p > Hosted...
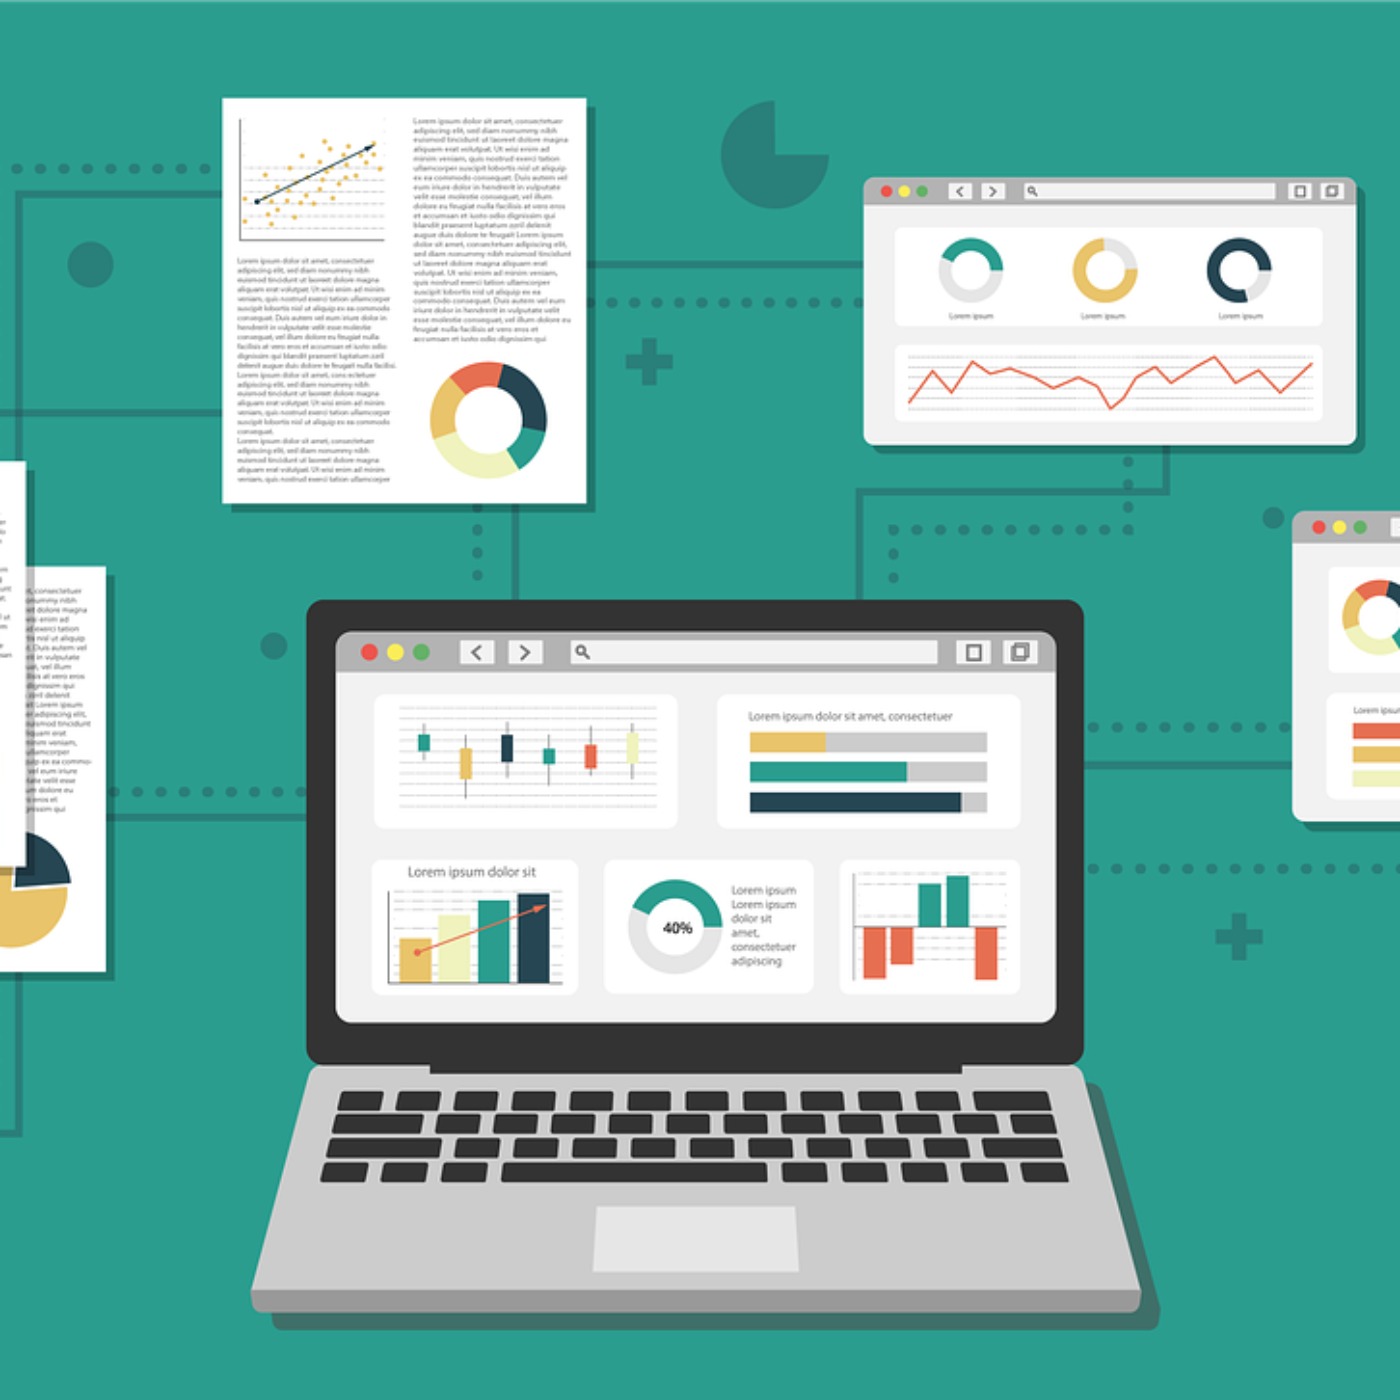
To create better-looking PowerBI dashboards, focus on clarity, simplicity, and interactivity. Start with a plan that clearly defines the dashboard's purpose and audience. Simplify by showcasing only key metrics, using...

Episode #2
As we look towards 2025, the landscape of data visualization and storytelling solutions is undergoing a significant transformation, driven mostly by important advances in artificial intelligence (AI). In this article...

Episode #1
Felipe Rego is a leading data science, analytics and data visualisation specialist. He develops analytics and data visualization solutions that help transform organizations. Felipe is also an global educator delivering...
PitchCentric classifies Chart Tales: Data Visualisation & Storytelling Ideas under these industries. Guests from them are the closest fit, and each links to the best podcasts in that industry.
Shows with the most semantically similar episode content. Pitch one, pitch all; producers cluster.

storytelling with data podcast

The Art of Communicating Data
The PolicyViz Podcast

Data Viz Today

Make Data Talk
The Present Beyond Measure Show: Data Storytelling, Presentation & Visualization
Is this podcast yours and you'd like to remove or correct details? Request removal or email privacy@pitchcentric.com.
Questions about the free trial? See the pricing FAQ